
1. pandas: for data preparation
Before analyzing data, it needs to be prepared: collected, cleaned of errors and duplicates, and structured. To ensure confidence in the results after analysis, it’s important to ensure the quality of the data first. The Python data analysis library pandas helps transform structured data and includes built-in tools for cleaning it.
Features of the pandas library :
● Allows you to work with huge amounts of data, including combining and splitting it.
● Supports DataFrames – special objects that allow you to analyze data more efficiently by turning it into indexed structured arrays.
● Accepts data from a variety of sources: databases, Excel spreadsheets, and others. Transforms data from various formats into formats suitable for analysis using Python.
With pandas, you can:
● Index, rename, sort, and merge data arrays.
● Update, add, and delete data.
● Recover and process missing data.
● Visualize data.
2. NumPy: for advanced calculations
After the pandas library has helped verify the data quality, you can move on to calculations. For example, calculating a retail outlet’s revenue by product range. In Excel, you’d have to combine, sum, and divide, but in Python, a single row can be enough to calculate a 10,000-row table. The NumPy library helps with this. It’s considered one of the main Python libraries for data analysis.
Features of the NumPy library :
● A variety of data structures that allow for more efficient searching, analysis, and structuring.
● The ability to perform complex scientific calculations with mathematical formulas, including on data in multidimensional arrays.
● Tools for converting data into different formats.
● Working with numeric and other data types.
With NumPy, you can:
● Multiply, add, align, index, slice, and reshape arrays.
● Create stack and broadcast arrays and split them into sections.
● Perform linear algebra calculations needed for complex data analysis in Python.
3. SciPy: for mathematical operations
As a specialist’s experience increases, the tasks will become more complex: they will need to resort to linear algebra, interpolation, integration, statistics, and other complex mathematical operations. Data analysts can use the SciPy library, which is built on top of NumPy arrays and functions, to achieve this.
SciPy Features:
● Fast and reliable execution of complex operations thanks to optimization.
● A wide range of functions and tools for a variety of operations.
● Contains many subpackages for specific tasks, such as Fourier transforms.
With SciPy, you can:
● Perform complex mathematical calculations: for example, solve differential equations or find numerical solutions to integrals.
● Process images.
● Work with genetic algorithms.
● Perform complex engineering calculations.
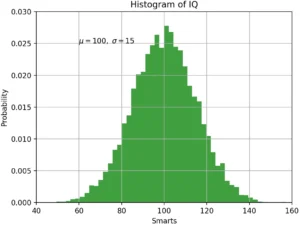
4. Matplotlib: for visualization
After analysis, the data needs to be presented in a digestible format. This is achieved using visualization tools. While some other packages offer these, Matplotlib supports a wide variety of graphs and charts.
Matplotlib Features:
● Allows you to quickly create diagrams and graphs of various types, and customize their design.
● Supports API for integrating graphs into developed applications.
● Can format diagrams and graphs for easier perception.
With Matplotlib, you can:
● Build 2D shapes.
● Generate line, scatter, bar, pie, and other charts based on data.
● Draw contour graphs.
● Generate vector fields and spectrograms.
● Quickly embed visualizations into services, programs, and applications.
5. Seaborn: For advanced visualization
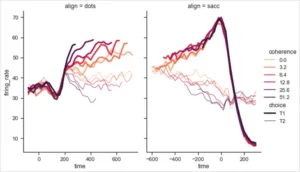
Features of the seaborn library :
● Tools for exploring and analyzing data before visualization.
● Support for data in various formats.
● Extensive options for customizing the appearance of graphs and creating complex visualizations.
With seaborn, you can:
● Calculate and visualize correlations—the relationships between different data.
● Analyze and compare data with each other, and create graphs based on this analysis.
● Create graphs suitable for demonstrating analysis visualization to those who do not have a deep understanding of the data.
6. statsmodels: for statistical analysis
Python has very few built-in tools for statistical analysis, making it inferior to some other data analysis languages, such as R. The statsmodels library addresses this shortcoming. It combines the graphical capabilities of Matplotlib, the data preparation tools of pandas, and the mathematical functionality of NumPy and SciPy. It also integrates some features of the Patsy library, allowing you to implement R formulas.
Features of statsmodels:
● Makes Python more efficient for those with R experience, as it supports many of the R methods.
● Suitable for statistical computing.
● Supports univariate and bivariate data analysis, allowing you to build generalized models and test hypotheses.
● Most often used by data scientists for complex calculations and machine learning.
● Compatible with other Python libraries and tools.
● Simplifies some complex mathematical problems.
With statsmodels, you can:
● Build complex statistical models, such as linear regression.
● Conduct statistical tests.
● Calculate correlation.
● Build generalized linear and Bayesian models.
● Test hypotheses using various methods.
7. Plotly: for 3D visualization
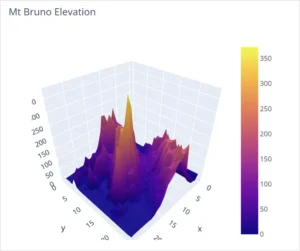
Plotly Features:
● Supports 3D visualizations and their advanced settings.
● Allows you to export analysis results in a special format – JSON. It is easy to open in other applications.
● Has one of the widest lists of supported charts.
● Can send data to cloud services for further work with it.
● Based on this library, there is another one, Dash, which allows you to build interactive dashboards for displaying data.
With Plotly, you can:
● Build any standard charts and graphs: pie, Gantt, tree.
● Create scientific maps: heat, contour, logarithmic, with vector fields.
● Build financial graphs.
8. Bokeh: for interactive visualization on the web
Bokeh Features:
● Support for all the basic visualization tools needed in data analytics and science.
● Support for various input data formats.
● Versions for other programming languages - once you master the library, you can use it when switching to another language.
● Compatibility with Python web development frameworks, such as Flask.
● Compatibility with other visualization libraries, such as Matplotlib.
With Bokeh, you can:
● Quickly embed a beautiful, interactive graph into a web page. It will automatically update when data changes and support sorting, slicing, and other tools.
● Build graphs based on data imported from different sources.
● Perform simple data analysis, such as calculating correlations.
9. scikit-learn: for machine learning
Machine learning models are typically developed by data scientists, but analysts sometimes also have to work with them. Scikit-learn, one of the main Python libraries for data science, is typically used to write and configure them.
Features of the scikit-learn library :
● The library has all the basic functions for machine learning built in.
● You can create models for both supervised and unsupervised learning.
● Evaluation mechanisms for created models can be connected.
● There is integration with NumPy, SciPy, and other computing libraries.
With scikit-learn, you can:
● Create machine learning models for classification, clustering, segmentation, data visualization, and other manipulations.
● Choose from multiple models.
● Tune model parameters and features.
● Preprocess input data for training.
Expert advice
Moses Gaspar
An analyst I know had a problem: he and his wife argued frequently. He decided to apply his data analysis skills to his life and compiled data on their arguments, including when they occurred and why, and then created a graph. It turned out that the “storm clouds” most often gathered in the evenings, when serious family and household issues were discussed.
The husband and wife would come home from work tired, unable to resolve anything important, and so the arguments began. After analyzing the arguments, they decided to avoid discussing complex household issues on weekdays and to postpone all serious conversations to weekends, where they would have them in a comfortable setting.
Thus, through a combination of problem-solving, analytical skills, and the simple Seaborn graphics library, their family and relationships were saved. With this story, I want to emphasize that analytical skills can help make more accurate and well-reasoned management decisions at any level of life, be it family or the workplace. The libraries listed above will be a convenient and modern tool to assist with this.