Cohort Analysis: Why Business Needs It and How to Conduct It
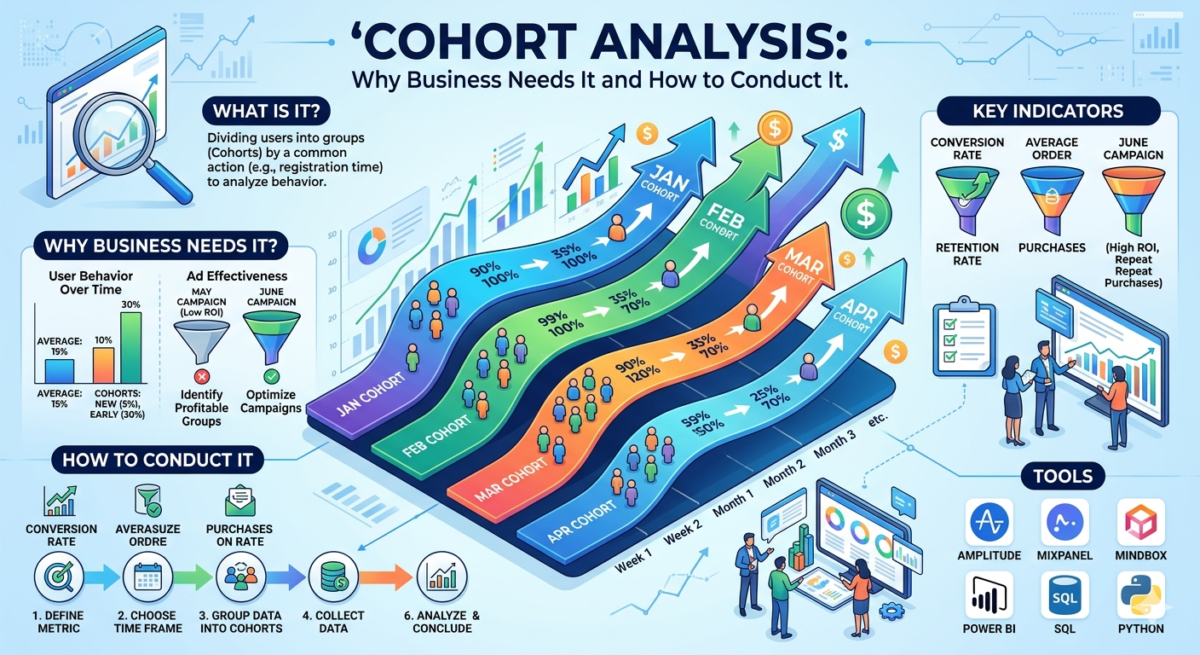
Table of Contents
What is cohort analysis?
To see when activity declines, we divide all users into cohorts: those who registered today, last month, two months ago, and so on. We then look at how each cohort behaves: how often they visit the site, how much time they spend there, what exactly they purchase, and how much they spend. This is cohort analysis.
Why do we need cohort analysis?
Understand how users or clients behave over time. For example, consider an online store website. Overall statistics for all users show that our visit-to-purchase conversion rate is 15%. But these are average figures.
If we divide users into cohorts, we see a different picture:
- Newly registered users have a 5% conversion rate.
- for those registered a month ago – 10%;
- For those registered even earlier, 30%.
Based on this data, it’s possible to conclude. For example, it might be assumed that customers take a long time to get to know a product and carefully consider their purchase. This information can help marketers plan marketing campaigns.
Track advertising effectiveness. For example, suppose you launched one advertising campaign in May and another in June. For analysis, you need to identify two cohorts of users: those acquired in May and those acquired in June. And monitor their behavior over time.
It may be that in May, many more people were attracted, but they made a purchase and never returned. Meanwhile, in June, fewer people were attracted, but they made more repeat purchases and had a higher average order value. Therefore, according to the cohort study, the June campaign was more beneficial for the business and is the one worth scaling up.
Key indicators of cohort analysis
● purchase,
● viewing specific pages,
● contacting a consultant,
● opening a marketing email,
● unsubscribe from the newsletter.
In addition to conversions, you can also look at other metrics when analyzing cohorts: average order value, time spent on site, and number of purchases. There are no hard and fast rules—you can take, calculate, and analyze whatever your business needs.
How to Conduct Audience Cohort Analysis
- They determine which specific indicator will be analyzed.
- They decide for what period of time the analysis is needed: week, month, or year.
- They decide what groups to divide users into. These could be cohorts based on days, weeks, months, or even years.
- They collect the necessary data, for example, on conversions.
- Group data into cohorts.
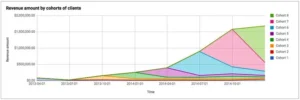
- They construct graphs to clearly see the behavior of each specific cohort.
After this, you can look at the graphs and conclude. For example, you might see that a particular advertising campaign was successful. Or you might see that new users are placing orders less frequently than older users—perhaps they’re struggling to navigate the interface. This type of cohort study analysis is the job of marketers and product managers.
Tools for cohort analysis
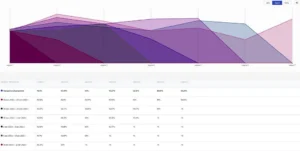
When serious analytics of large volumes of data is required, custom solutions come into play. Databases are used to store the information, and analysts extract the necessary information using hand-written SQL or Python scripts. This data is then visualized using specialized tools such as Tableau, Power BI, DataStudio, and DataLens. These tools allow for the creation of graphs and charts to visually present the results of a cohort study.
This approach allows you to extract any data, divide users into arbitrary cohorts, and combine statistics from different platforms.