Data Analysis in Microsoft Power BI: Tools, Features, How to Use, and Who It’s For
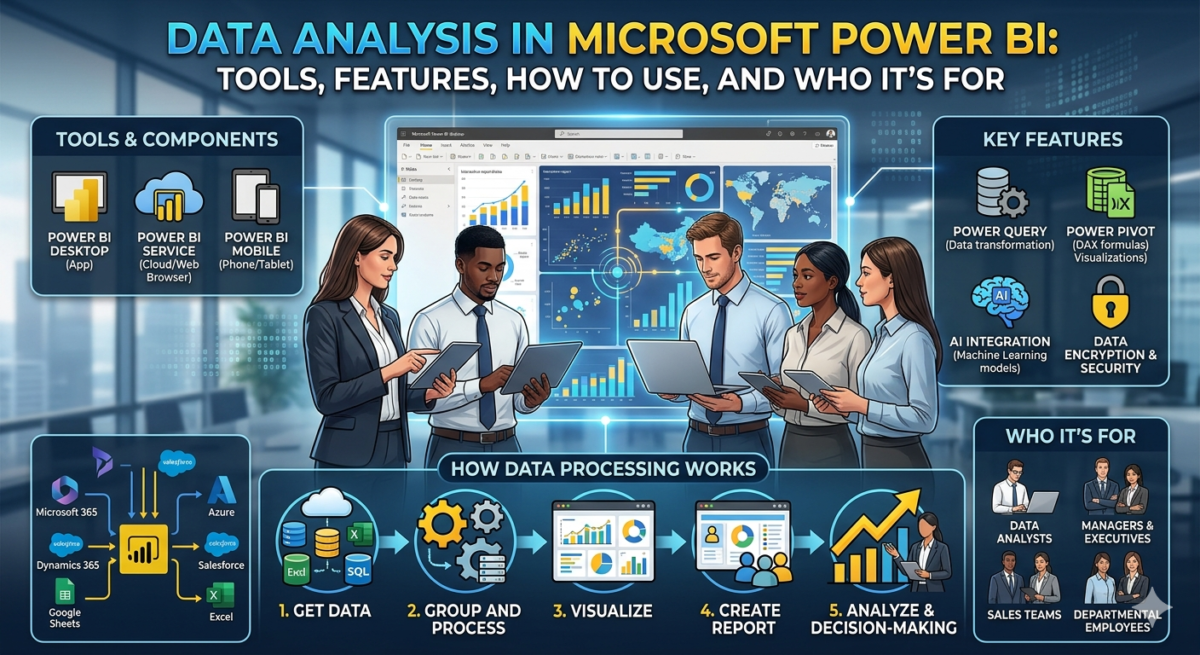
Table of Contents
We’ll explain how and why you need Microsoft Power BI, which platform services you might find useful, and how to integrate them into your work.
What is Microsoft Power BI?
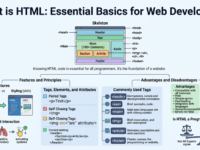
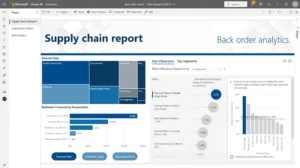
Microsoft Power BI is a business intelligence platform designed for processing and visualizing data. It collects information from various sources, structures it into a unified format, and enables the creation of a variety of visual representations. These visualizations are combined into interactive reports that help you easily analyze data. Furthermore, reports can be customized to meet specific metrics and requirements.
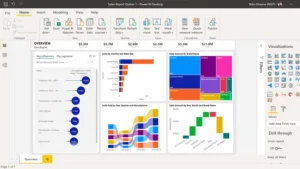
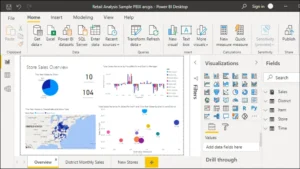
This is what the Power BI interface looks like. Source
Power BI is considered one of the easiest-to-learn business analytics tools, suitable not only for data scientists but also for managers, executives, and employees across various departments. For example, a sales team can use Power BI to quickly and clearly analyze current data.The platform consists of a desktop application, a cloud service, and a mobile app. You can create interactive dashboards in Power BI Desktop and publish and view reports via a web browser or mobile devices. This allows you to, for example, track sales results, manage finances, or evaluate the effectiveness of promotions directly on your smartphone or tablet.
How does this work?
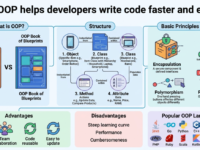
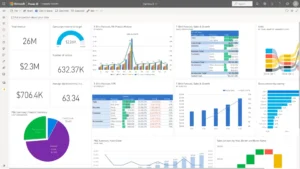
The platform allows you to analyze all company data. Source
The platform allows you to analyze all company data, visualize it, and share it with employees. This means that multiple people across the globe can work simultaneously with the same dashboard. All you need is a license and wireless network access. Power BI access settings can be personalized for each employee, data can be encrypted, and access can be monitored in real time.Microsoft Power BI is powered by AI technologies, enabling users to build machine learning models and analyze structured and unstructured data, including images and text.
To integrate data analytics with content, audience, and campaign management, the Power BI platform leverages Adobe Creative Cloud. This simplifies working with Microsoft Power BI dashboards in Adobe Analytics. This allows analysts working with Power BI to leverage cloud-based data feeds from Adobe Analytics, Dynamics 365, and other sources to create interactive dashboards.
Power BI reports can be embedded directly into apps and web pages.
Here’s a step-by-step look at how data processing works in the Power BI system:
- We download data from an online or local source.
- We group and process the data loaded into the system.
- We visualize the created data models.
- We create an interactive report from several models—essentially, it’s an intelligent interactive dashboard with multi-user access.
- We use the resulting dashboard for analysis and business decision-making.
Using Power BI
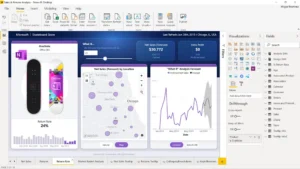
All reports can be viewed on one screen. Source
Power BI is accessible to data analysts and business analysts alike, thanks to its ease of use and integration with other services.
The application interface is available in different language versions, including Russian, but DAX and Power Query queries are written in English.
Account setup
You can download Power BI Desktop from the official website. Before downloading, be sure to select the interface language.To connect to Power BI, you need to create an account and select a license based on your use case. A paid license allows you to publish reports both to the cloud and to local storage, and share them even with users who aren’t registered with the service. To register, please provide an email address. Whether you plan to use a paid license and share reports or use the program for free, the email address must be a corporate one.
Please also remember that the free version sets a limit on the amount of data you can download—no more than 1 GB.
Power BI Desktop is a free desktop application that lets you import data from local and online sources, process and analyze it, and then transform and visualize it to create dashboards, graphical information panels, and data models.
Visualization is available in the form of elements such as graphs and charts with interactive features.
The desktop version of the app is updated monthly. These updates include both new features and refinements to existing ones based on user feedback.
Please note: Microsoft has suspended all new sales of products and services, including Power BI, in Russia.
Tools for working with Power BI
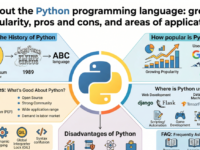
AI technologies can be integrated into the service. Source
Data analysis with Microsoft Power BI doesn’t require SQL query writing or advanced database knowledge. However, familiarity with business analytics tools in Excel, such as Power Query and Power Pivot, including DAX formulas, is required. It’s also recommended to be able to write scripts in Python and R. This can be useful when connecting data sources.
The fact is that Power BI Desktop consists of three integrated services, each with its own interface:
● Power Query – a query editor that loads and cleans data;
● Power Pivot – for working with tabular data in RAM;
● Power View – for visualization and reporting.
You can access your data using on-premises and cloud services such as Dynamics 365, Salesforce, Azure SQL DB, Excel, and SharePoint. Power Query helps you
prepare your data for analysis. You can analyze your data using the DAX language.
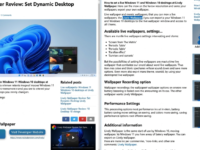
You can upload data to the Power BI desktop app for processing using the Get Data button. This will display a full list of services and sources from which you can upload data.
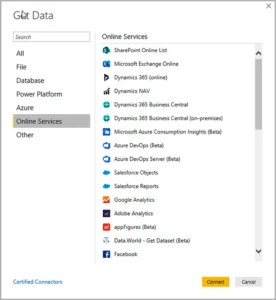
The Get Data window in Power BI Desktop displays the different categories of data sources you can connect to. Source
If you select a database as the source, you will need to provide the information required to connect to the server.Data loaded from different sources can be converted into a unified format using the Power Query editor.
Once you’ve transformed the data and created a model, you can add a visual element by selecting the visualization icon and dragging it onto the model. You can similarly change visualization types.
There are many different types of visualizations available in Power BI Desktop. Source
Power BI’s available visualization types include line charts, bar charts, combination charts, waterfall charts, funnel charts, pie charts, scatter charts, and other types of charts, as well as gauges, speedometers, cards, tables, and even geographic maps. This opens up a wide range of app possibilities. For example, a map can allow large companies to visualize sales figures across different countries or cities. Additional visualization types from other developers are also available for download, some of which require a fee.Several visual elements can be combined into a report, which can consist of one or several sheets, similar to an Excel document.
A Power BI report can consist of different visualization elements. Source
A brief overview of Microsoft Power BI capabilities
Power BI features allow you to combine large volumes of data, process it, and then present it in a convenient format, categorizing it for further analysis. Different types of data can be combined into a unified format. Models can be created using custom formulas and metrics to monitor business processes and results. Data analysis in Power BI also allows for sharing and reporting.
All data can not only be analyzed but also interactively visualized right within the program. Simply drag and drop elements and create visualizations, choosing from hundreds of visuals designed specifically for Power BI.

The service has a catalog of interactive visualizations. Source
Embedding Power BI into applications is available to developers with programming experience in ASP.NET, Visual C#, HTML, and JavaScript. Microsoft offers a free course on this topic. However, even users without such knowledge can implement simple, basic functions in the service.The platform will allow companies with multiple sales channels, complex CRM systems, and large volumes of incoming data to easily and quickly organize and analyze data.
Using the Power BI system allows managers and executives to track trends, quickly analyze business indicators, identify risk and opportunity areas, and identify potential growth and scalability points.