Python, Pandas, and Anaconda: What’s Inside the Jupyter Notebook

What is a Jupyter notebook, and where is it used?
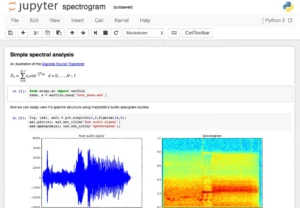
Jupyter Notebook has two main parts: the web application and notebooks—files that handle the program’s source code, run it, and output data in various formats. Two formats are used for notebook export: PDF and HTML.
What you can do in the web application:
● run and edit code in the browser;
● show the results of calculations using diagrams and graphs;
● Use Markdown and LaTeX markup languages.
One of the advantages of this tool is that code can be divided into chunks and worked on in any order. For example, you can write a script and immediately see how it works. There’s no need to run the remaining code fragments; the results appear immediately, beneath the code fragment. This is how data scientists display preliminary research results and create graphs and charts.
The easiest way to get the hang of Jupyter Notebook is to use it as a calculator for everyday tasks. For example, keeping track of your family budget and comparing income and expenses.
Supported languages
Python is most commonly used with Jupyter notebooks, but other programming languages are also supported, such as R, Ruby, Pearl, and even JavaScript—around 40 languages in total. No need to install them— Python magic commands help you work with code from another kernel. These are called magic commands, and they come in two types:
● lowercase – starts with %;
● cellular – start with %%.
To switch to Ruby, for example, you would enter %%ruby.
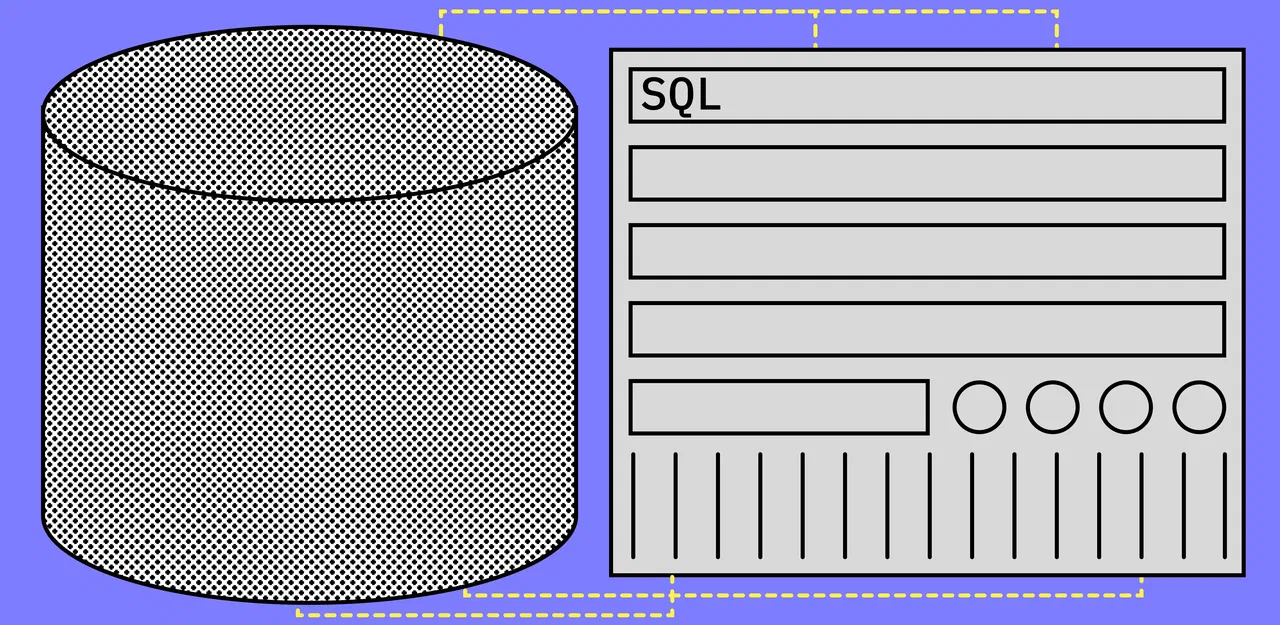
Experienced users combine SQL and Python within Jupyter notebooks. SQL is good for extracting data and working with statistics, while Python is used when the data needs to be analyzed. Jupyter Notebooks can connect to any SQL database, such as MySQL, Postgres, Snowflake, MariaDB, and Azure, allowing you to write SQL queries with just a few lines of code.
How to run Jupyter Notebook
Jupyter Notebook can be run in two ways: locally and in the cloud.
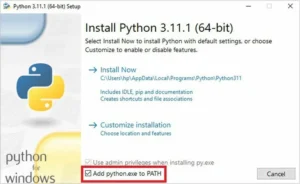
Installing on a local computer will take longer, but the code will run faster. Let’s say the user is running Windows 10 or 11. First, download and install Python 3.3 or later from the official website.
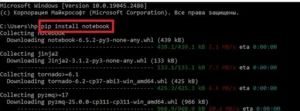
After that, you need to go to the command line and install the notebook itself. A special utility called pip will help with this. It can be used to unpack, install, or update programs, including Jupyter. The utility is downloaded to your computer along with Python. To install the notebook, enter the command:
pip install notebook
This installation option is suitable for beginners. For experienced professionals, there’s an alternative way to install Jupyter Notebook on a computer: download Anaconda. This is a Python distribution and file repository used primarily for data analysis and machine learning. Jupyter Notebook and its extension, JupyterLab, are included in this distribution.
A laptop runs slower in the cloud, but you can immediately start coding. One of the cloud-based versions of Jupyter Notebook is Google Colab. It’s often used in machine learning training programs. It works in any browser and requires no special configuration.
How to work with a laptop
Let’s look at a few tasks that will help you understand how to work with Jupyter Notebook.
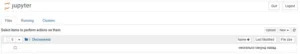
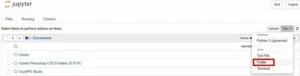
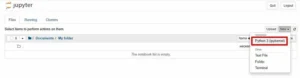
To start a new project, launch Jupyter Notebook and create a project folder. Then click New on the right side of the screen and select Folder from the menu.
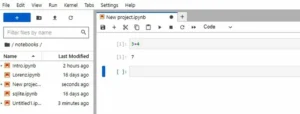
Now you can move on to the next level and try to solve a simple problem – add 3 and 4.
To do this, set the Code property, enter 3 + 4 in the cell, and press Ctrl + Enter or Shift + Enter. In the first case, the entered code will be executed by the Python interpreter; in the second case, the code will be executed, and another cell will appear. To run the code in the cloud version of Jupyter, simply click Run → Run Selected Cells.
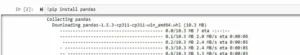
Let’s try a more complex task: drawing a graph. If the laptop is newly installed, graphs won’t be displayed on its workspace. To display them, you’ll need the pandas and Matplotlib libraries. Pandas is used to analyze data in tables, while Matplotlib helps you create graphs and charts.
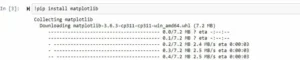
You can add libraries using the commands in the cell:
!pip install pandas
!pip install matplotlib
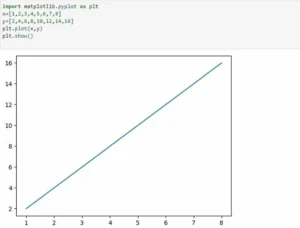
On the new Jupyter page, you need to run the code for a simple line graph:
import matplotlib.pyplot as plt
x=[1,2,3,4,5,6,7,8]
y=[2,4,6,8,10,12,14,16]
plt.plot(x,y)
plt.show()
The first line imports the pyplot graphing library from the Matplotlib API. The third and fourth lines are the x- and y-axes. To plot the graph, call the plot() method, and to display it, call the show() method.
To turn a straight line into a curve, you need to substitute other values for the y-axis:
import matplotlib.pyplot as plt
x=[3,4,5,6,7,8,9,10,11,12]
y= [9,16,25,36,49,64,81,100,121,144]
plt.plot(x,y)
plt.show()
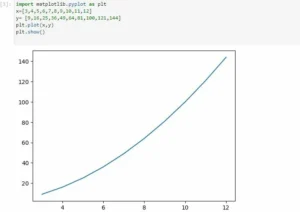
The convenience of the Matplotlib library is that the scale is calculated and applied automatically. The number of values for the x- and y-axes is the same. If one is smaller than the other, an error will occur when running the code, and the plot will not display.
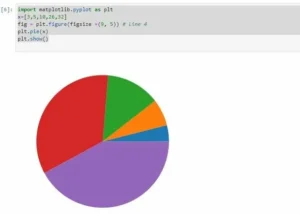
Matplotlib is suitable not only for graphs but also for charts. It uses figsize, a method that allows you to change the size of a chart. All chart sizes on a Jupyter notebook are set by the library, so visualizing data in the desired format can be difficult. The figsize method is useful when you need to, for example, make a figure larger or smaller by changing its aspect ratio. The official pandas documentation recommends using an aspect ratio of 1, but you can use any aspect ratio. For example, to plot a chart:
import matplotlib.pyplot as plt
x=[3,5,10,26,32]
fig = plt.figure(figsize =(9, 5)) # line 4
plt.pie(x)
plt.show()
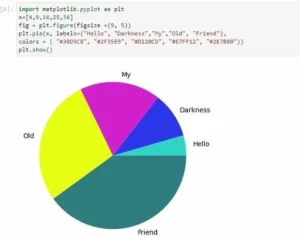
A pie chart has two main properties: colors and labels. Colors are used to colorize sections of the chart. You can do this with text, such as “purple,” or use hexadecimal notation (e.g., #7554E2). Labels are used to label sections of the chart. Specifying both properties will update the previous chart:
import matplotlib.pyplot as plt
x=[4,9,16,25,36]
fig = plt.figure(figsize =(9, 5))
plt.pie(x, labels=(“Hello”, “Darkness”, “My”, “Old”, “Friend”),
colors = (“#30D5C8”, “#2F35E9”, “#D220CD”, “#E7FF12”, “#2E7B80”))
plt.show()
How to make working with Jupyter Notebook more convenient
1. Install laptop extensions.
By default, the Jupyter notebook lacks many functions that would make working much faster. But this is easy to fix.
To install extensions, you need to run the code in the command line or terminal:
pip install jupyter_contrib_nbextensions
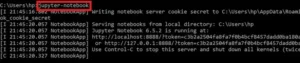
Then run the code to add the nbextensions files to the Jupyter server’s search directory:
jupyter contrib nbextension install
A tab called “Nbextensions” should appear in your notebook. Clicking it will reveal a list of extensions. For example, shortcuts for launching multiple cells, cell movement, file search, and autocomplete.
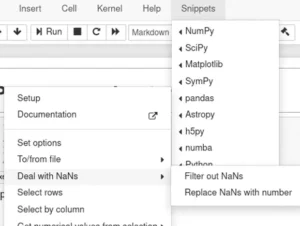
Importing popular modules like pandas and Matplotlib every time, or remembering new ones, is a waste of time. The Snippets extension solves these problems. It appears as another menu, and inside it, you’ll find library documentation and available functions.
2. Use more than just Google Colab.
There are many ways to run a Jupyter notebook in the cloud. For example, a free alternative to Google Colaboratory is Kaggle Kernels. This notebook’s user interface differs from the original Jupyter, but it comes pre-installed with various data science packages. It’s a great option for those just getting started with machine learning and want to compete with other students. Competitions in this field are held on the Kaggle website.
JupyterLite is a notebook that runs entirely in the browser. It’s perfect for students and teachers, for example, when they need to create a very simple visualization but don’t have time to install libraries.
Deepnote is a team version of Jupyter Notebook. It works similarly to Google Docs: you can edit your project in real time. You can also create personal notebooks. Deepnote has many different features: planning, converting your notebook into an app, creating diagrams, and much more. It integrates with GitHub, PostgreSQL, BigQuery, Redshift, and more.
Another notebook option is Mercury. It turns a Python notebook into an interactive web application that allows you to hide the code and display only the widgets.
Expert advice
In a JupyterIn a
notebook, you can run different pieces of code in any order. This is convenient, but more for experienced users. The left side of the notebook screen shows the order in which cells are run, and beginners often forget this. As a result, the cells are arranged in random order, causing the code to run with errors, and sometimes it’s completely unclear what it does. At a minimum, each notebook should contain a clear title, a brief introduction, a description, and a conclusion. It’s important to arrange the cells in the order in which they are run. Before publishing the notebook, you should ensure that the code runs without errors.